NOTE: PyXLL 5 includes matplotlib integration.
See Charts and Plotting for details.
This post can be used for earlier versions of PyXLL, but we recommend updating the PyXLL 5 and using that instead.
Python has a broad range of tools for data analysis and visualisation. While Excel is able to produce various types of plots, sometimes it’s either not quite good enough or it’s just preferable to use matplotlib.
Users already familiar with matplotlib will be aware that when showing a plot as part of a Python script the script stops while a plot is shown and continues once the user has closed it. When doing the same in an IPython console when a plot is shown control returns to the IPython prompt immediately, which is useful for interactive development.
Something that has been asked a couple of times is how to use matplotlib within Excel using PyXLL. As matplotlib is just a Python package like any other it can be imported and used in the same way as from any Python script. The difficulty is that when showing a plot the call to matplotlib blocks and so control isn’t returned to Excel until the user closes the window.
This blog shows how to plot data from Excel using matplotlib and PyXLL so that Excel can continue to be used while a plot window is active, and so that same window can be updated whenever the data in Excel is updated.
Basic plotting
Matplotlib can plot just about anything you can imagine! For this blog I’ll be using only a very simple plot to illustrate how it can be done in Excel. There are examples of hundreds of other types of plots on the matplotlib website that can all be used in exactly the same way as this example in Excel.
To start off we’ll write a simple function that takes two columns of data (our x and y values), calculates the exponentially weighted moving average (EWMA) of the y values, and then plot them together as a line plot.
Note that our function could take a pandas dataframe or series quite easily, but just to keep things as simple as possible I’ll stick to plain numpy arrays. To see how to use pandas datatypes with PyXLL see the pandas examples on github: https://github.com/pyxll/pyxll-examples/tree/master/pandas.
from pyxll import xl_func
from pandas.stats.moments import ewma
import matplotlib.pyplot as plt

@xl_func("numpy_column<float> xs, "
         "numpy_column<float> ys, "
         "int span: string")
def mpl_plot_ewma(xs, ys, span):
    # calculate the moving average
    ewma_ys = ewma(ys, span=span)

    # plot the data
    plt.plot(xs, ys, alpha=0.4, label="Raw")
    plt.plot(xs, ewma_ys, label="EWMA")
    plt.legend()

    # show the plot
    plt.show()

    return "Done!"
To add this code to Excel save it to a Python file and add it to the pyxll.cfg file (see for details).
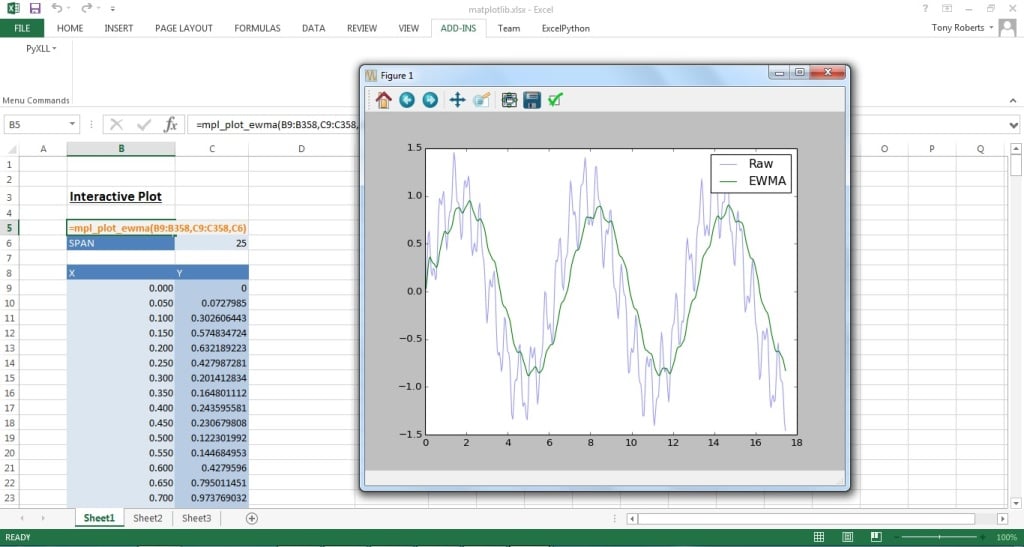
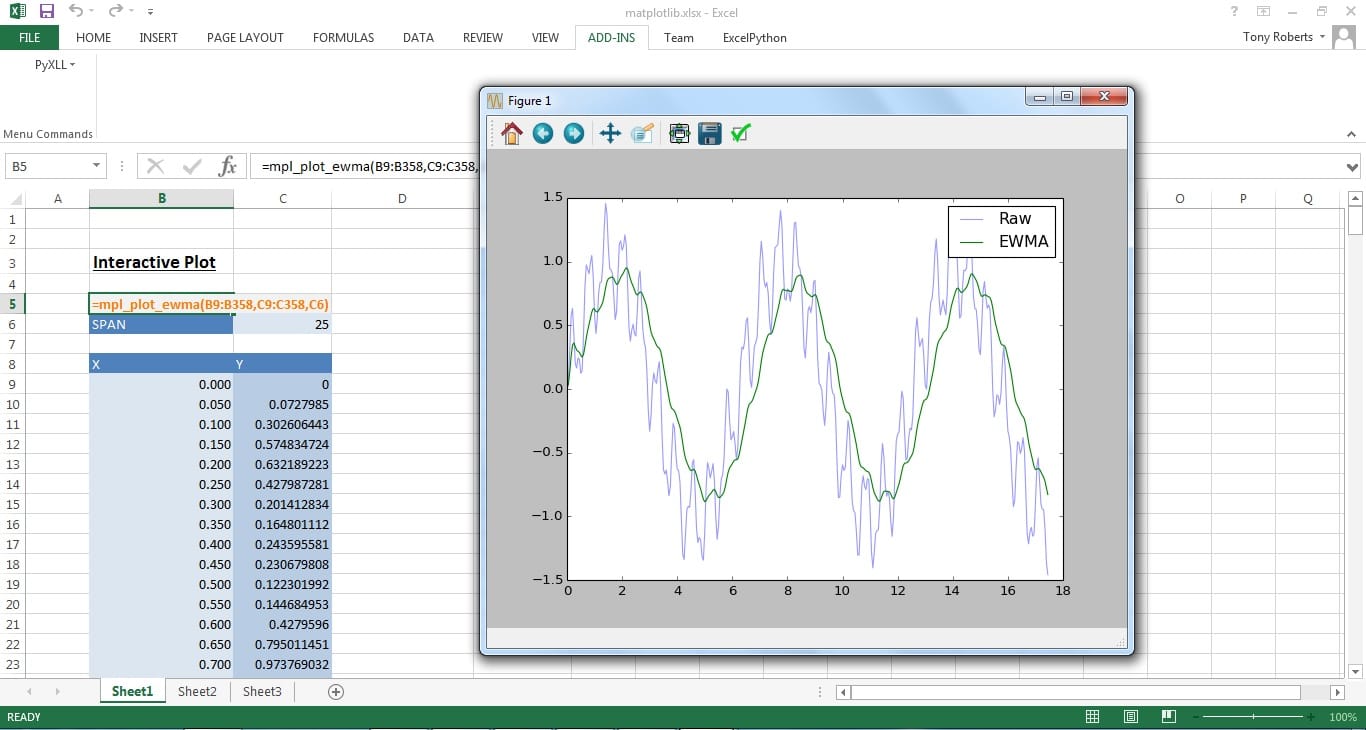
Calling this function from Excel brings up a matplotlib window with the expected plot. However, Excel won’t respond to any user input until after the window is closed as the plt.show() call blocks until the window is closed.
The unsmoothed data is generated with the Excel formula =SIN(B9)+SIN(B9*10)/3+SIN(B9*100)/7. This could just as easily be data retrieved from a database or the output from another calculation.
Non-blocking plotting
Matplotlib has several backends which enables it to be used with different UI toolkits.
Qt is a popular UI toolkit with Python bindings, one of which is PySide. Matplotlib supports this as a backend, and we can use it to show plots in Excel without using the blocking call plt.show(). This means we can show the plot and continue to use Excel while the plot window is open.
In order to make a Qt application work inside Excel it needs to be polled periodically from the main windows loop. This means it will respond to user inputs without blocking the Excel process, or stopping Excel from receiving user input. Using the windows ‘timer’ module is an easy way to do this. Using the timer module has the advantage that it keeps all the UI code in the same thread as Excel’s main window loop, which keeps things simple.
from PySide import QtCore, QtGui
import timer

def get_qt_app():
    """
    returns the global QtGui.QApplication instance and starts
    the event loop if necessary.
    """
    app = QtCore.QCoreApplication.instance()
    if app is None:
        # create a new application
        app = QtGui.QApplication([])

        # use timer to process events periodically
        processing_events = {}
        def qt_timer_callback(timer_id, time):
            if timer_id in processing_events:
                return
            processing_events[timer_id] = True
            try:
                app = QtCore.QCoreApplication.instance()
                if app is not None:
                    app.processEvents(QtCore.QEventLoop.AllEvents, 300)
            finally:
                del processing_events[timer_id]

        timer.set_timer(100, qt_timer_callback)

    return app
This can be used to embed any Qt windows and dialogs in Excel, not just matplotlib windows.
Now all that’s left is to update the plotting function to plot to a Qt window instead of using pyplot.show(). Also we can give each plot a name so that when the data in Excel changes and our plotting function gets called again it re-plots to the same window instead of creating a new one each time.
from matplotlib.figure import Figure
from matplotlib.backends.backend_qt4agg import FigureCanvasQTAgg as FigureCanvas
from matplotlib.backends.backend_qt4agg import NavigationToolbar2QT as NavigationToolbar

# dict to keep track of any plot windows
_plot_windows = {}

@xl_func("string figname, "
         "numpy_column<float> xs, "
         "numpy_column<float> ys, "
         "int span: string")
def mpl_plot_ewma(figname, xs, ys, span):
    """
    Show a matplotlib line plot of xs vs ys and ewma(ys, span)
    in an interactive window.

    :param figname: name to use for this plot's window
    :param xs: list of x values as a column
    :param ys: list of y values as a column
    :param span: ewma span
    """
    # create the figure and axes for the plot
    fig = Figure(figsize=(600, 600), dpi=72, facecolor=(1, 1, 1), edgecolor=(0, 0, 0))
    ax = fig.add_subplot(111)

    # calculate the moving average
    ewma_ys = ewma(ys, span=span)

    # plot the data
    ax.plot(xs, ys, alpha=0.4, label="Raw")
    ax.plot(xs, ewma_ys, label="EWMA")
    ax.legend()

    # Get the Qt app.
    # Note: no need to 'exec' this as it will be polled in the main windows loop.
    app = get_qt_app()

    # generate the canvas to display the plot
    canvas = FigureCanvas(fig)

    # Get or create the Qt windows to show the chart in.
    if figname in _plot_windows:
        # get the existing window from the global dict and
        # clear any previous widgets
        window = _plot_windows[figname]
        layout = window.layout()
        if layout:
            for i in reversed(range(layout.count())):
                layout.itemAt(i).widget().setParent(None)
    else:
        # create a new window for this plot and store it for next time
        window = QtGui.QWidget()
        window.resize(800, 600)
        window.setWindowTitle(figname)
        _plot_windows[figname] = window

    # create the navigation toolbar
    toolbar = NavigationToolbar(canvas, window)

    # add the canvas and toolbar to the window
    layout = window.layout() or QtGui.QVBoxLayout()
    layout.addWidget(canvas)
    layout.addWidget(toolbar)
    window.setLayout(layout)

    # showing the window won't block
    window.show()

    return "[Plotted '%s']" % figname
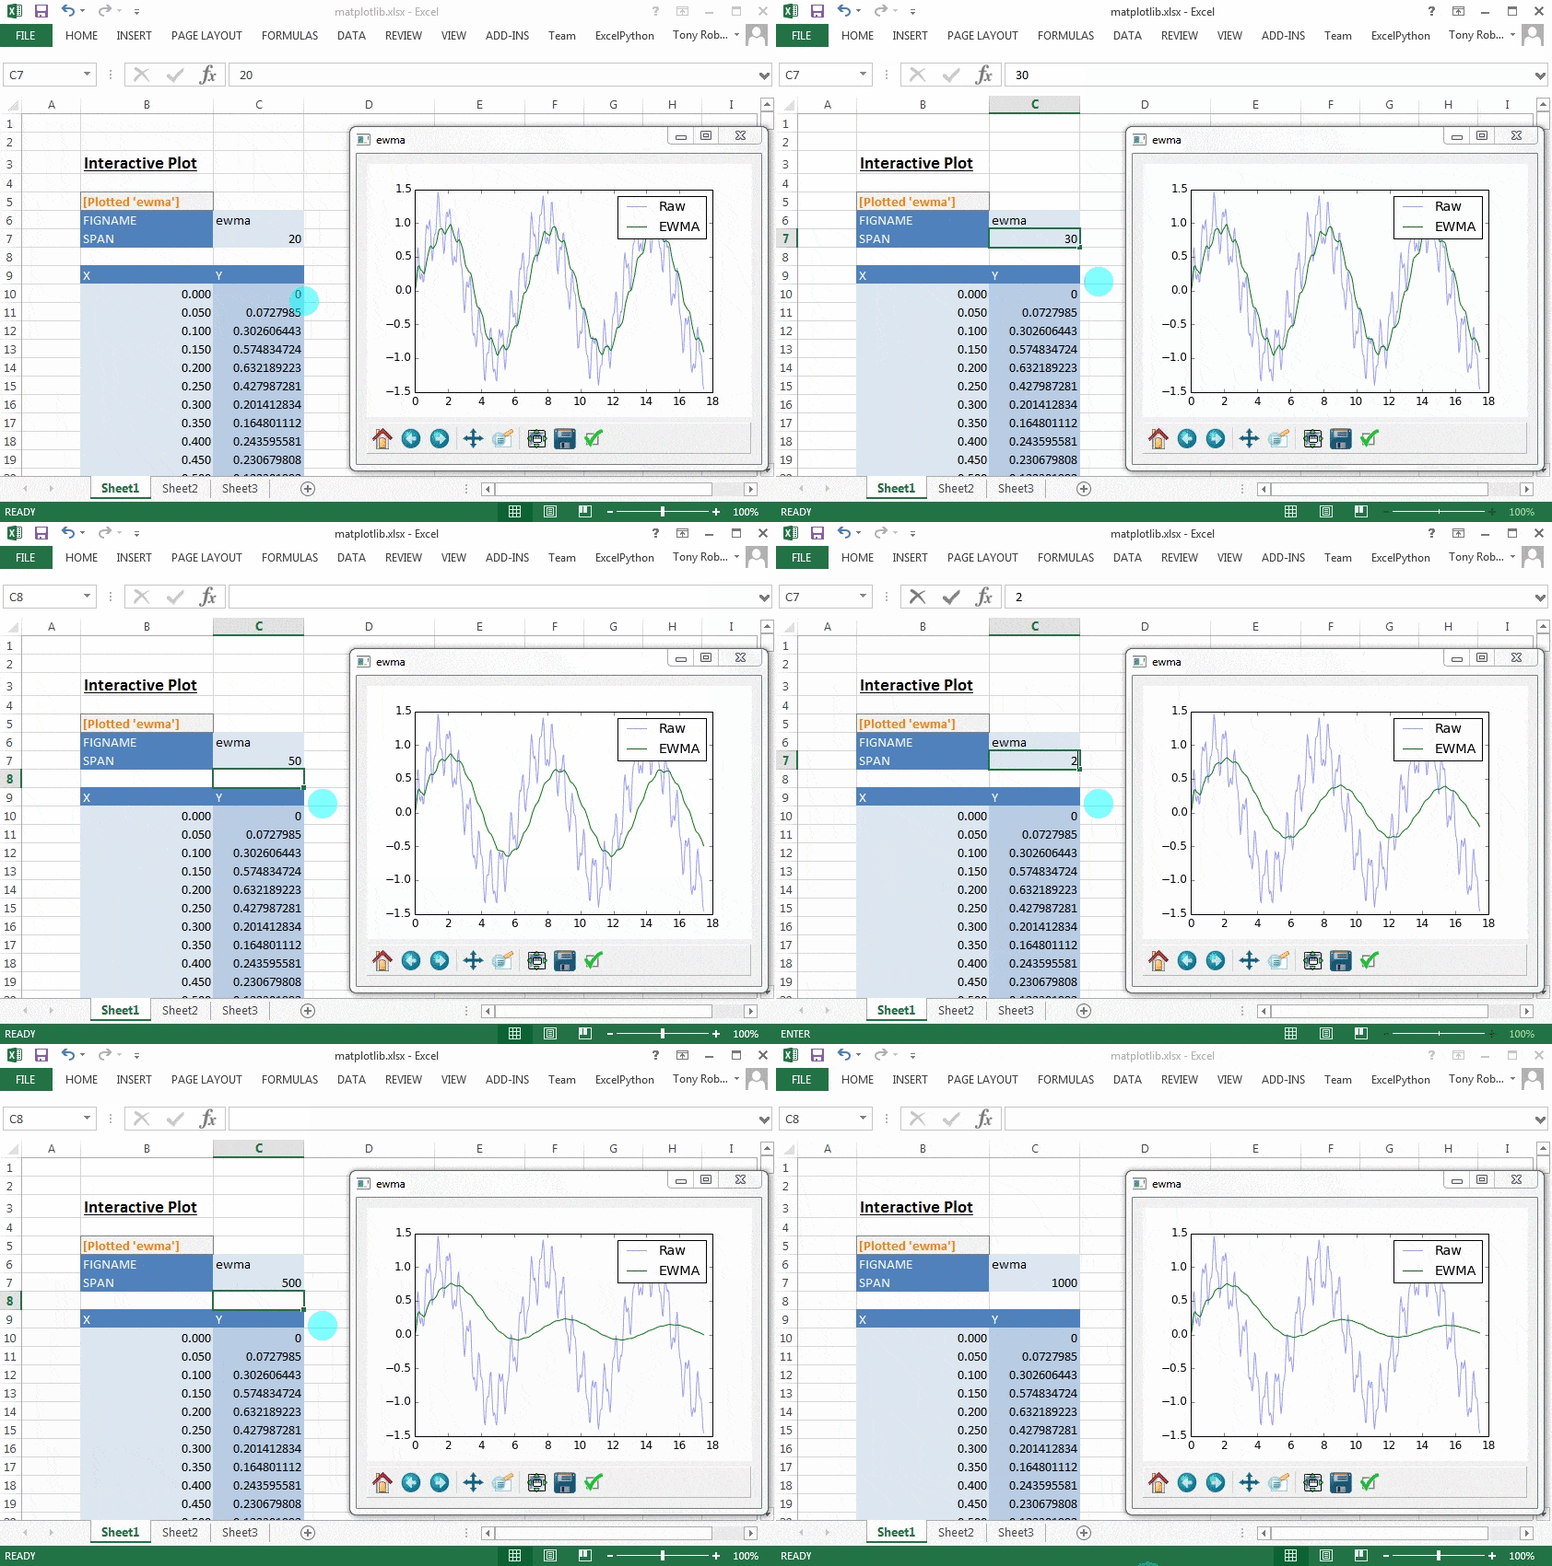
When the function’s called it brings up the plot in a new window and control returns immediately to Excel. The plot window can be interacted with and Excel still responds to user input in the usual way.
When the data in the spreadsheet changes the plot function is called again and it redraws the plot in the same window.
Next steps
The code above could be refined and the code for creating, fetching and clearing the windows could be refactored into some reusable utility code. It was presented in a single function for clarity.
Plotting to a separate window from Excel is sometimes useful, especially as the interactive controls can be used and may be incorporated into other Qt dialogs. However, sometimes it’s nicer to be able to present a graph in Excel as a control in the Excel grid in the same way the native Excel charts work. This is possible using PyXLL and matplotlib and will be the subject of the next blog!
All the code from this blog is available on github https://github.com/pyxll/pyxll-examples/tree/master/matplotlib.


