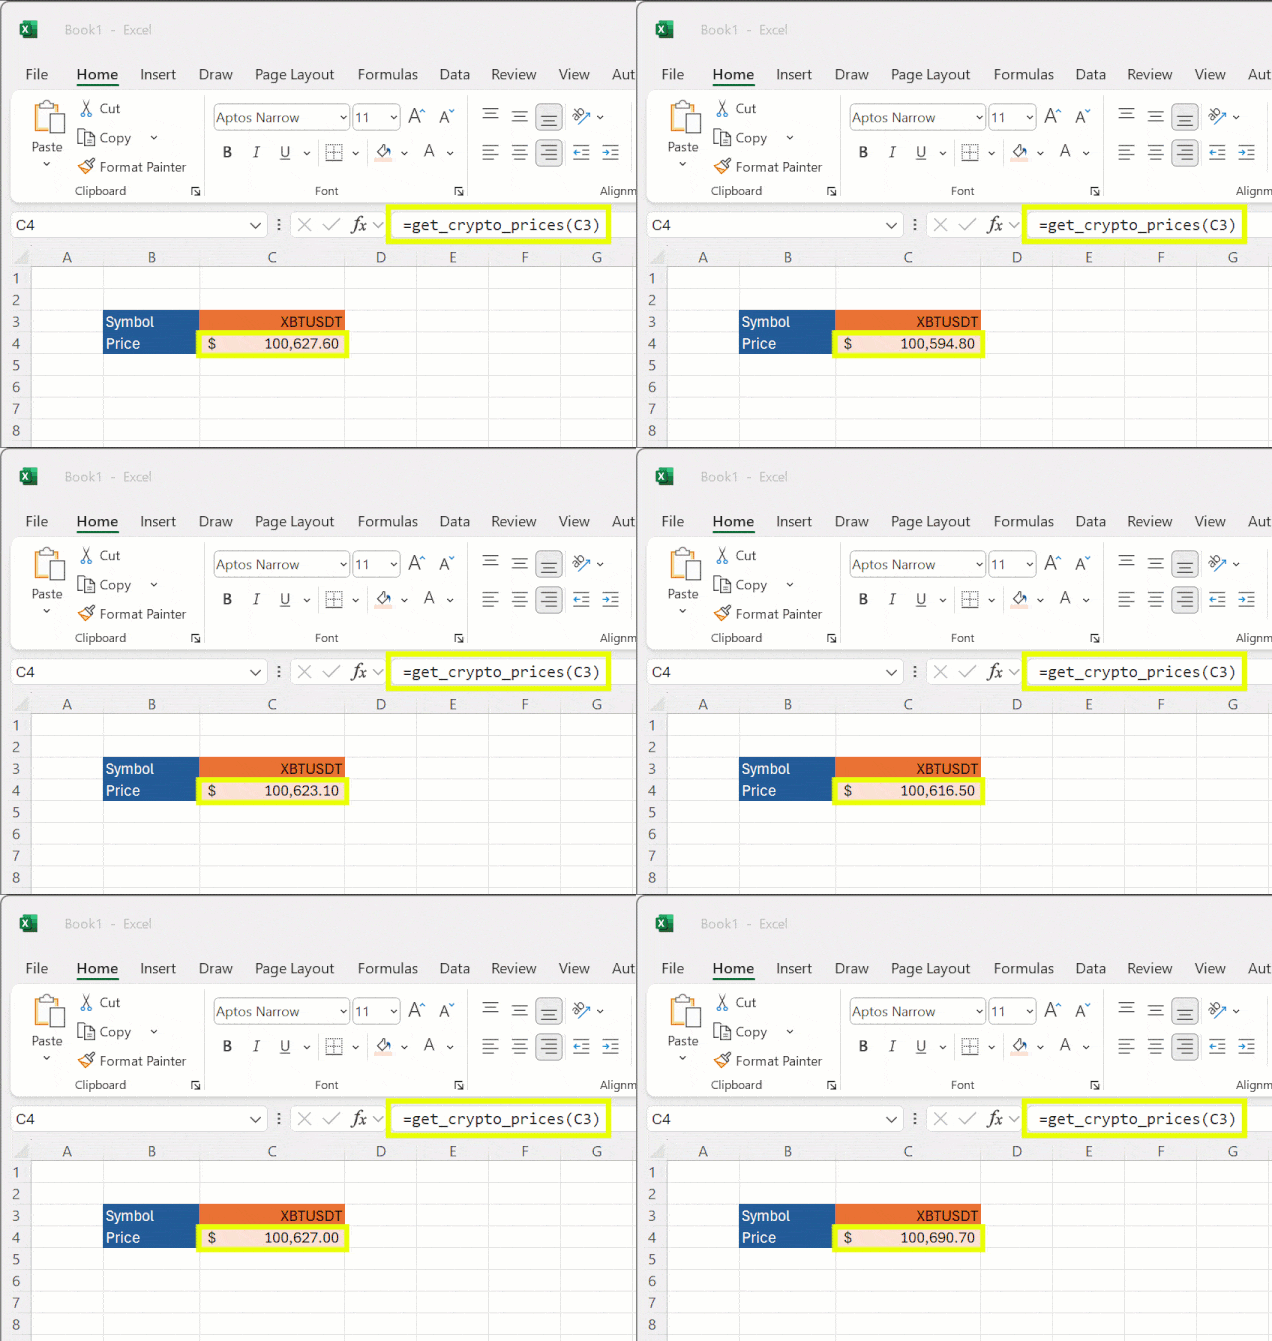
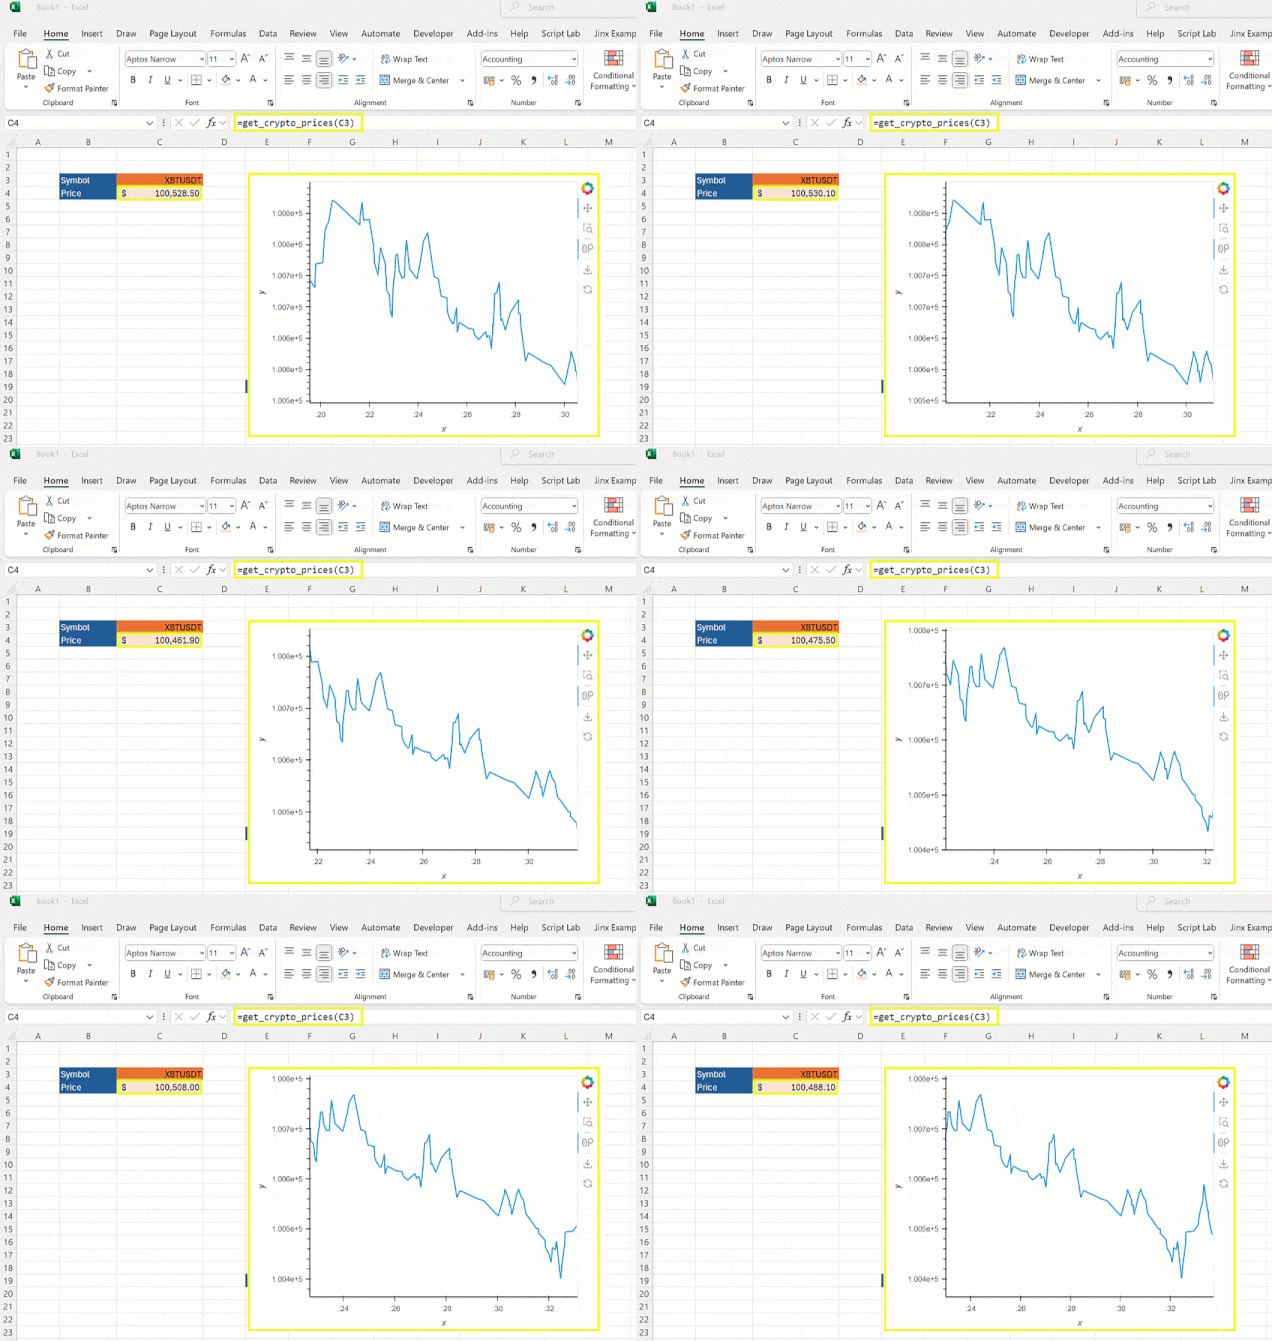
A customer recently asked me how to create a live, updating, real-time chart in Excel using the Python Excel add-in PyXLL. It turns out with the right plotting library it’s much easier than you might think!
In this tutorial, we’ll explore how to combine Python’s HoloViz and Panel libraries with PyXLL to create a dynamic and interactive experience. By the end, you’ll have a fully functional Excel-based dashboard displaying real-time cryptocurrency prices.
If you’re not already familiar with PyXLL, it is an Excel add-in that makes it possible to fully integrate Python applications into Excel. With PyXLL, you can write any Python code, using any third party packages, and run your code in Excel with ease. PyXLL is used by firms worldwide to deliver powerful applications and toolkits written in Python to Excel users.
Why Use HoloViews, Panel, and PyXLL?
- HoloViews: A powerful visualization library that makes it easy to create complex plots and charts.
- Panel: A high-level app framework that allows embedding of interactive plots and dashboards into various environments.
- PyXLL: A bridge between Python and Excel that enables seamless integration of Python functions, plots, and even interactive web-based content directly into Excel.
HoloViews and Panel are both part of the HoloViz project (https://holoviz.org/). There are many different plotting libraries for Python to choose from. I selected HoloViz for this project as it allows creating charts of live, updating, timeseries of data.
The Python Excel add-in PyXLL is what allows us to build Python applications in Excel. We’ll use that to write a UDF (worksheet function) that returns live prices as a real time stream of values. PyXLL’s plotting features is what will allow us to chart those values directly in Excel using HoloViews.
Support for HoloViz objects is added to PyXLL by the extension package pyxll-holoviz.
Setting Up Your Environment
Before diving in, ensure you have the following installed:
- A local Python environment on your PC
- Required Python packages: pyxll, pyxll-holoviz, websockets, holoviews, panel, and pandas
- PyXLL (you can use the 30 day free trial if you don’t have a license)
To install the packages, run:
pip install pyxll pyxll-holoviz websockets holoviews panel pandas
Ensure that you have properly configured the Excel add-in PyXLL by following the PyXLL documentation.
Fetching Live Crypto Prices
We’ll the Bitmex websocket API to stream live crypto prices. Here’s a Python function to retrieve and process the data:
import websockets
import dateutil.parser
import json

async def get_crypto_prices(symbol: str):
    uri = "wss://www.bitmex.com/realtime"
        # Send a message to subscribe to price updates
        msg = {
            "op": "subscribe",
            "args": [f"instrument:{symbol}"]
        }
        await websocket.send(json.dumps(msg))

        # Receive messages in a loop and yield each price as it updates
        while True:
            result = await websocket.recv()
            for data in json.loads(result).get("data", []):
                price = data.get("lastPrice")
                if price:
                    yield price
And to test that out we can add the following to the end of the code above and save it in a .py file:
import asyncio

async def main():
    async for price in get_crypto_prices("XBTUSDT"):
        print(price)

if __name__ == "__main__":
    loop = asyncio.get_event_loop()
    loop.run_until_complete(main())
Running that Python script prints out the XBTUSDT price each time it updates… Now to get that in Excel!
Turning our Live Crypto Prices Function into an Excel “Real Time Data” Function
To turn our “get_crypto_prices” prices function written above into a function we can call from Excel, all we need to do is to apply the “@pyxll.xl_func” decorator. We use the xl_func decorator to tell PyXLL that we want it to be exposed to Excel as an “RTD” or “Real Time Data” function.
import pyxll
import websockets
import json

@pyxll.xl_func("str symbol: rtd<float>")
async def get_crypto_prices(symbol: str):
    uri = "wss://www.bitmex.com/realtime"
        # Send a message to subscribe to price updates
        msg = {
            "op": "subscribe",
            "args": [f"instrument:{symbol}"]
        }
        await websocket.send(json.dumps(msg))

        # Receive messages in a loop and yield each price as it updates
        while True:
            result = await websocket.recv()
            for data in json.loads(result).get("data", []):
                price = data.get("lastPrice")
                if price:
                    yield price
And with just that two line change, we now have everything we need to get streaming real time crypto prices in Excel!
The PyXLL add-in needs to be configured to load our module (.py file) by adding the path of the folder containing the .py file to the “pythonpath” setting, and the module name (the file name without the .py extension) to the “modules” setting.
Once PyXLL is configured and we’ve either reloaded the PyXLL add-in or restarted Excel, we can now call this function directly from Excel as a worksheet function.

Adding a Live Updating Chart to Excel with HoloViz and PyXLL
The PyXLL function “pyxll.plot” can take a Python chart and embed it into Excel. The extra package “pyxll-holoviz” included in the requirements above extends PyXLL’s native plotting capabilities and adds support for HoloViz charts and panels objects.
If you haven’t pip installed “pyxll-holoviz” already, then you’ll need to do that now for this next step.
HoloViews has a whole section in its documentation dedicated to streaming data, https://holoviews.org/user_guide/Streaming_Data.html. This is what we will use to plot our streaming crypto prices.
The HoloViews documentation has this example showing how we can create a DynamicMap object with a Curve, using data that’s accumulated over time in a Buffer:
# Construct a DynamicMap object with a Curve sourcing data from a Buffer
example = pd.DataFrame({'x': [], 'y': [], 'count': []}, columns=['x', 'y', 'count'])
dfstream = Buffer(example, length=100, index=False)
curve_dmap = hv.DynamicMap(hv.Curve, streams=[dfstream])

...

# Send data to the Buffer object
data = gen_data()
for i in range(200):
    dfstream.send(next(data))
This is exactly what we need in order to create a price chart that updates as new prices are received.
from holoviews.streams import Buffer
import holoviews as hv
import pandas as pd
import dateutil.parser
import pyxll
import websockets
import json

@pyxll.xl_func("str symbol: rtd<float>")
async def get_crypto_prices(symbol: str):
    uri = "wss://www.bitmex.com/realtime"
        # Send a message to subscribe to price updates
        msg = {
            "op": "subscribe",
            "args": [f"instrument:{symbol}"]
        }
        await websocket.send(json.dumps(msg))

        # Create our DynamicMap with a Curve, using data from a Buffer
        stream = Buffer(pd.DataFrame({"x": [], "y": []}), length=100, index=False)
        dmap = hv.DynamicMap(hv.Curve, streams=[stream]).opts(responsive=True)

        # Receive messages in a loop and yield each price as it updates
        while True:
            result = await websocket.recv()
            for data in json.loads(result).get("data", []):
                price = data.get("lastPrice")
                if price:
                    # Add the timestamp and last price to the buffer
                    timestamp = dateutil.parser.parse(timestamp)
                    df = pd.DataFrame([(timestamp, price)], columns=["x", "y"])
                    stream.send(df)

                    yield price
Now we’ve got a HoloViews DynamicMap object with a Curve, using data from a Buffer that we’re adding to each time a new price comes. All that’s left to do is to display that in Excel.
To display the DynamicMap, all we need to do is to wrap it in a Panel and then use “pyxll.plot” to show that in Excel. The “pyxll-holoviz’ package is what enables the “pyxll.plot” function to be able to show a HoloViz panel object (it just needs to be installed, we don’t need to import it).
from holoviews.streams import Buffer
import holoviews as hv
import panel as pn
import pandas as pd
import dateutil.parser
import pyxll
import websockets
import json

@pyxll.xl_func("str symbol: rtd<float>")
async def get_crypto_prices(symbol: str):
    uri = "wss://www.bitmex.com/realtime"
    async with websockets.connect(uri) as websocket:
        # Send a message to subscribe to XBTUSD updates
        msg = {
            "op": "subscribe",
            "args": [f"instrument:{symbol}"]
        }
        await websocket.send(json.dumps(msg))

        stream = Buffer(pd.DataFrame({"x": [], "y": []}), length=100, index=False)
        dmap = hv.DynamicMap(hv.Curve, streams=[stream]).opts(responsive=True)

        panel = pn.panel(dmap, sizing_mode="stretch_both")
        pyxll.plot(panel, name=f"{symbol}")

        # Receive messages in a loop and add them to a queue
        while True:
            result = await websocket.recv()
            for data in json.loads(result).get("data", []):
                price = data.get("lastPrice")
                if price:
                    # Add the timestamp and last price to the buffer
                    timestamp = dateutil.parser.parse(timestamp)
                    df = pd.DataFrame([(timestamp, price)], columns=["x", "y"])
                    stream.send(df)

                    # yield the lastest price to update in Excel
                    yield price
We only need to call “pyxll.plot” once. That will embed the panel object in Excel and it will update automatically. Each time the Buffer stream receives new data the chart updates!

Conclusion
By combining HoloViews, Panel, and PyXLL, you can unlock powerful and visually stunning tools for working with any live data (not just crypto!) directly in Excel. This integration offers endless possibilities for financial analysis and decision-making right within your favorite spreadsheet software.
Have fun experimenting and enhancing your dashboard! If you have questions or improvements to share, contact us and let us know!