NOTE: PyXLL 5 includes matplotlib integration.
See Charts and Plotting for details.
This post can be used for earlier versions of PyXLL, but we recommend updating the PyXLL 5 and using that instead.
Part 1 of this blog series demonstrated how to use matplotlib to plot charts and display them from Excel using the matplotlib Qt backend. That method opened the charts as new windows on top of the existing Excel workbook in the same way as if you were displaying them using an interactive Python prompt like IPython. They were made non-blocking so that Excel could still be used while the charts were displayed.
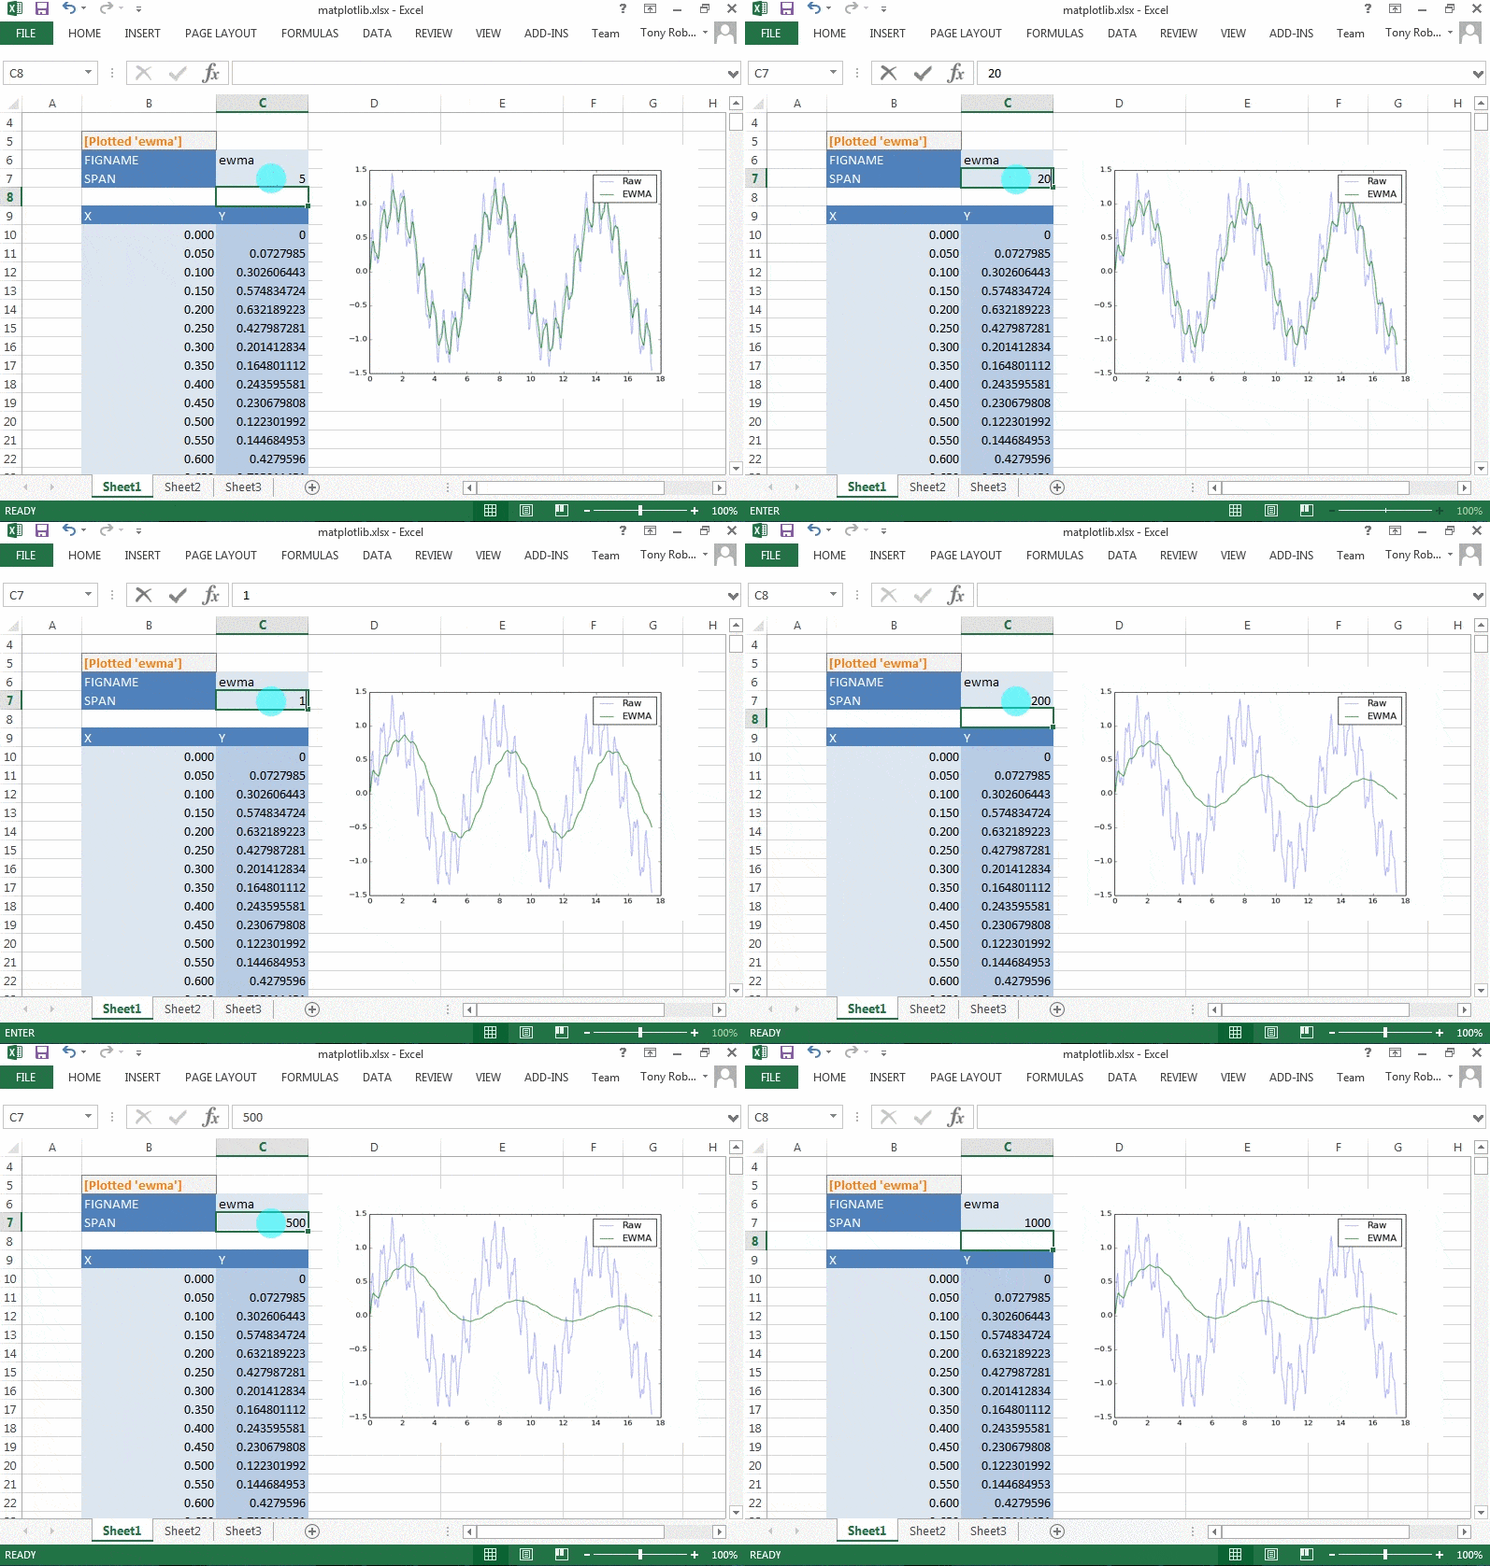
This second part will show another way to use matplotlib in Excel using PyXLL, but will embed the charts into the Excel worksheet rather than open new windows. This is preferable in some situations, such as when creating reports where the charts should be in-line alongside the data.
Embedded Plotting
Embedding a matplotlib chart into Excel is reasonably straightforward. Previously we used the Qt backend to render on to an interactive window, but for embedding we will use the ability of matplotlib to plot to an image file and insert that into Excel as a picture. By naming the picture in Excel we can find it and replace it when the source data for that chart is changed. This will have the effect of making the chart update live as the data in the spreadsheet changes.
We’ll start off with some code similar to that from Part 1 to plot the exponentially weighted moving average of a series.
frompyxllimportxl_func, xlfCallerfrompandas.stats.momentsimportewmaimportos# matplotlib importsfrommatplotlib.backends.backend_aggimportFigureCanvasAgg as FigureCanvasfrommatplotlib.figureimportFigure# For interacting with Excel from Pythonfrompyxllimportget_active_objectimportwin32com.client@xl_func("string figname, ""numpy_column<float> xs, ""numpy_column<float> ys, ""int span: string",macro=True)defmpl_plot_ewma_embedded(figname, xs, ys, span):# create the figure and axes for the plotfig=Figure(figsize=(8,6), dpi=75, facecolor=(1,1,1), edgecolor=(0,0,0))ax=fig.add_subplot(111)# calculate the moving averageewma_ys=ewma(ys, span=span)# plot the dataax.plot(xs, ys, alpha=0.4, label="Raw")ax.plot(xs, ewma_ys, label="EWMA")ax.legend()# write the figure to a temporary image filefilename=os.path.join(os.environ["TEMP"],"xlplot_%s.png"%figname)canvas=FigureCanvas(fig)canvas.draw()canvas.print_png(filename)
Now we have an image file containing the matplotlib chart. To display that in Excel we use the AddPicture method on the Shapes property of the Worksheet.
The Excel Object API is the same when accessed in Python via COM as when programmed in VBA so it may already be familiar to you. It is well documented on the Microsoft Developer Network (MSDN) web pages and, although not in Python, the information there can be helpful (see http://msdn.microsoft.com/en-us/library/office/ff194068(v=office.15).aspx).
The code below uses the PyXLL function xlfCaller to get the calling cell’s address and adds the picture below that cell. If you wanted to add the chart to another sheet you could pass the sheet name to the function and use that, or pass a cell reference using the xl_cell argument type.
Before adding the picture we look for any existing picture with the same name on the sheet and if one exists the position and dimensions of the existing picture are used when creating the new one and the existing one is deleted.
When the picture is created Excel takes a copy of the image data and so the temporary image file may be deleted afterwards.
# continued from above...# Show the figure in Excel as a Picture object on the same sheet# the function is being called from.xl=xl_app()caller=xlfCaller()sheet=xl.Range(caller.address).Worksheet# if a picture with the same figname already exists then get the position# and size from the old picture and delete it.forold_pictureinsheet.Pictures():ifold_picture.Name==figname:height=old_picture.Heightwidth=old_picture.Widthtop=old_picture.Topleft=old_picture.Leftold_picture.Delete()breakelse:# otherwise place the picture below the calling cell.top_left=sheet.Cells(caller.rect.last_row+2, caller.rect.last_col+1)top=top_left.Topleft=top_left.Leftwidth, height=fig.bbox.bounds[2:]# insert the picturepicture=sheet.Shapes.AddPicture(Filename=filename,LinkToFile=0,# msoFalseSaveWithDocument=-1,# msoTrueLeft=left,Top=top,Width=width,Height=height)# set the name of the new picture so we can find it next timepicture.Name=figname# delete the temporary fileos.unlink(filename)return"[Plotted '%s']"%figname
All the code from this blog is available on github https://github.com/pyxll/pyxll-examples/tree/master/matplotlib.
