To plot a Matplotlib figure in Excel you first create the figure in exactly the same way you would
in any Python script using matplotlib, and then use PyXLL’s plot function to show it
in the Excel workbook.
Plots created using matplotlib are displayed in Excel as images and are not interactive controls.
Note
Using matplotlib with PyXLL requires matplotlib to be installed. This can be done using
pip install matplotlib, or conda install matplotlib if you are using Anaconda.
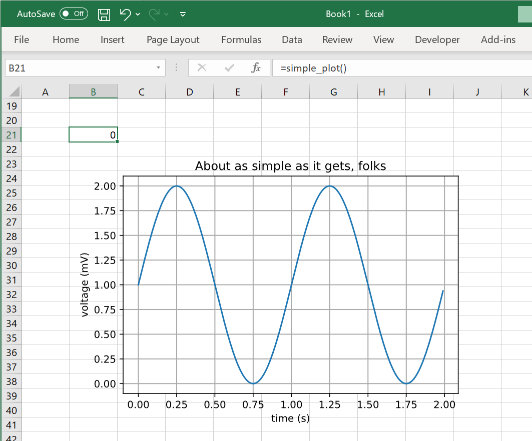
For example, the code below is an Excel worksheet function that generates a matplotlib chart and then displays it in Excel.
from pyxll import xl_func, plot
import matplotlib
import matplotlib.pyplot as plt
import numpy as np

@xl_func
def simple_plot():
    # Data for plotting
    t = np.arange(0.0, 2.0, 0.01)
    s = 1 + np.sin(2 * np.pi * t)

    # Create the figure and plot the data
    fig, ax = plt.subplots()
    ax.plot(t, s)

    ax.set(xlabel='time (s)', ylabel='voltage (mV)',
           title='About as simple as it gets, folks')
    ax.grid()

    # Display the figure in Excel
    plot(fig)
Note
There is no need to select a backend using matplotlib.use. PyXLL will select the backend
automatically.
When this function is called from Excel the matplotlib figure is drawn below the cell the function was called from.

The plotting code above was taken from the matplotlib examples. You can find many more examples on the matplotlib website as well as documentation on how to use all of matplotlib’s features.
Tip
Whenever you change an input argument to your plotting function, the chart will be redrawn.
You can use this to create interactive dashboards where the Excel user can control the inputs to the plot and see it redraw automatically.
Pyplot is part of matplotlib and provides a convenient layer for interactive work. If you are more familiar with pyplot and want to use it with PyXLL then that is no problem!
Instead of calling pyplot.show() to show the current plot, use plot without passing
a figure and it will show the current plot in Excel. After plotting the current pyplot figure
is closed.
from pyxll import xl_func, plot
import numpy as np
import matplotlib.pyplot as plt

@xl_func
def pyplot():
    # Draw a plot using pyplot
    x = np.arange(0, 5, 0.1);
    y = np.sin(x)
    plt.plot(x, y)

    # Display it in Excel using pyxll.plot
    plot()
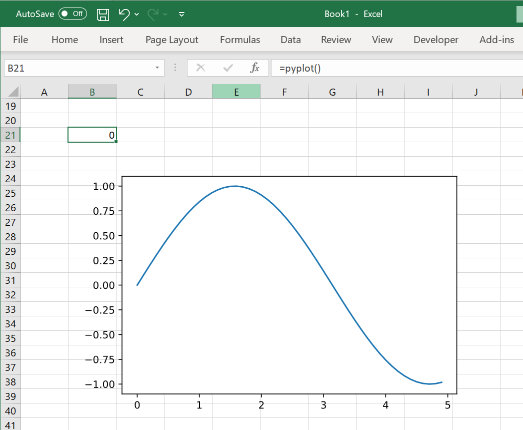
As with the previous example when this function is called from Excel the plot is shown below the calling cell.

Matplotlib can be used to create animated plots as well as static ones. These can also be used in Excel with PyXLL.
Note
Support for animated matplotlib plots is new in PyXLL 5.4.0.

Animated plots using matplotlib are created using the matplotlib.animation.Animation type. The animation object
can be passed to plot in the same way a Figure was used above. The animated plot will be
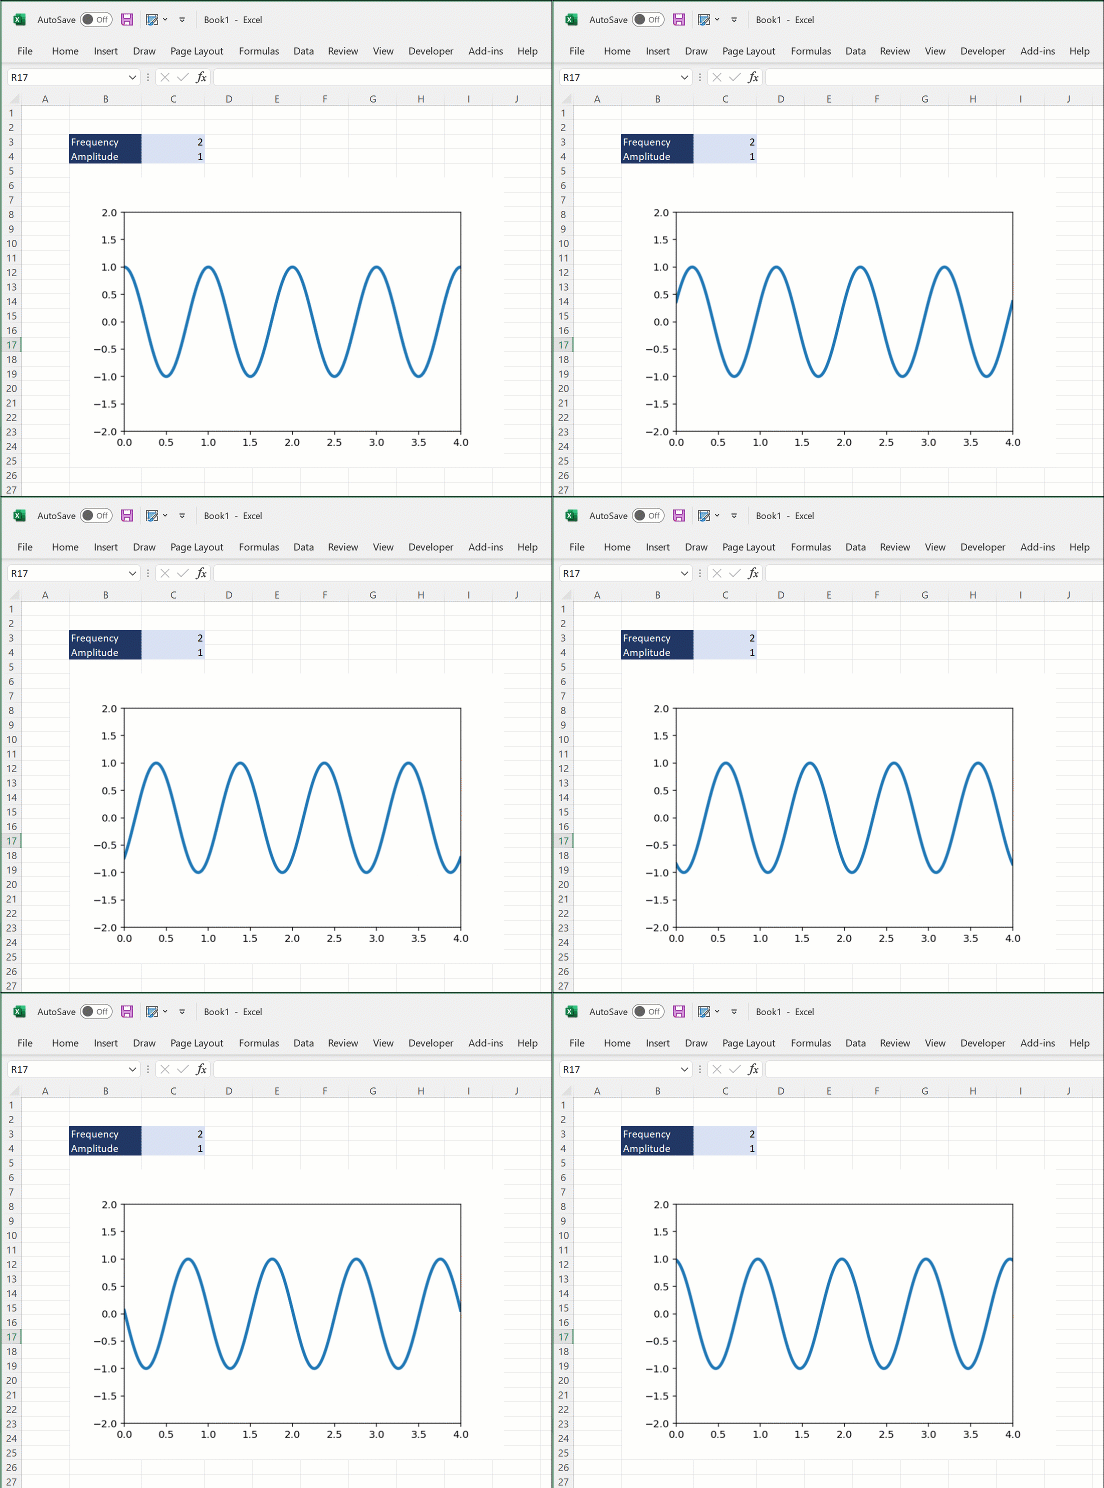
rendered to an animated GIF and embedded in the Excel workbook.
Warning
If you see an error saying that the image cannot be displayed then this will be because your version of Excel is not capable of displaying animated GIFs and you will need to update to a newer version of Excel.
The following code shows how to construct a simple animated plot with matplotlib and display the results in Excel. It can take a small amount of time to render the animation, depending on the number of frames and complexity of the plot.
from pyxll import xl_func, plot

from matplotlib.animation import FuncAnimation
from matplotlib import pyplot as plt
import numpy as np


@xl_func
def plot_sine_wave(frequency=1, amplitude=1):
    # Create the matplotlib Figure object, axes and a line
    fig = plt.figure(facecolor='white')
    ax = plt.axes(xlim=(0, 4), ylim=(-2 * amplitude, 2 * amplitude))
    line, = ax.plot([], [], lw=3)

    # The init function is called at the start of the animation
    def init():
        line.set_data([], [])
        return line,

    # The animate function is called for each frame of the animation
    def animate(i):
        x = np.linspace(0, 4, 1000)
        y = np.sin(frequency * 2 * np.pi * (x - 0.01 * i)) * amplitude
        line.set_data(x, y)
        return line,

    # Construct the Animation object
    anim = FuncAnimation(fig,
                         animate,
                         init_func=init,
                         frames=100,
                         interval=20,
                         blit=True)

    # Call pyxll.plot with the Animation object to render the animation
    # and display it in Excel.
    plot(anim)
For more information about animated plots in matplotlib please refer to the matplotlib user guide.