There will be times when developing your Python code you will run into problems and need to debug you code to understand what is going wrong.
The simplest form of debugging is to add logging or print statements to your functions and examine the output in the PyXLL log file. Certainly, looking at the log file is usually the first thing to do when faced with a problem!
For more complex debugging it is common to use an interactive debugger inside a Python IDE. An interactive debugger allows the user to step through code, line by line, examine variables, and see exactly what’s going on in the code.
The videos in this section cover deubbing using some of the more popular Python IDEs.
We recommend watching Writing Excel Functions in Python as a prerequisite to these videos.
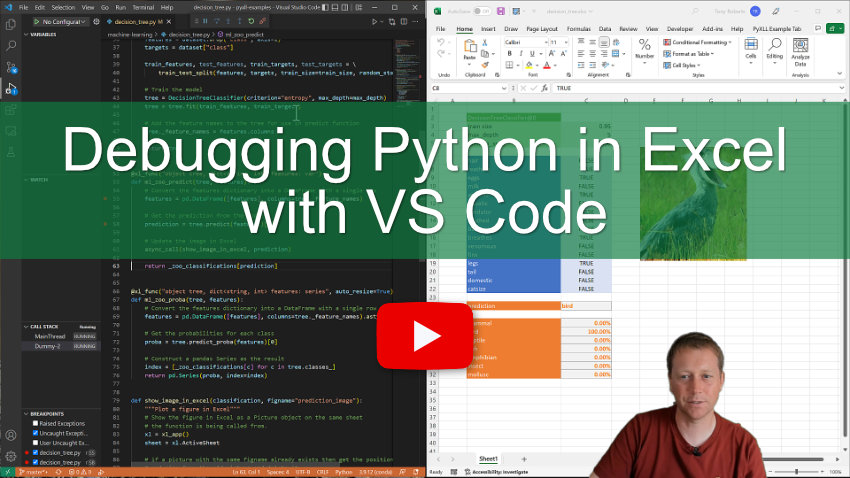
This tutorial will show you how to debug your PyXLL functions using the Visual Studio Code (or VS Code) IDE.
Using VS Code and PyXLL you can step through and debug your Python code running in Excel in the same way you can debug Python scripts started by VS Code.

This video covers the following topics:
Attaching the VS Code debugger to Excel
Solving a common problem with attaching the debugger
Also see our blog post Use VS Code to Debug Python Functions in Excel.
This tutorial will show you how to debug your PyXLL functions using the PyCharm IDE.
To debug using PyCharm you need to be using the PyCharm Professional as the Community Edition does not have the remote debugging capability needed to debug code running in another process like Excel.

This video covers the following topics:
Configuring PyCharm for remote debugging
Attaching to PyCharm from Excel
Stepping through your Python code line by line
Also see our blog post Debug Python in Excel with PyCharm.